From ledger to landing — FP&A that explains itself
COMPASS connects close, variance, forecast, plan and board pack on one spine. AI agents size the month,
find the drivers and draft the commentary with evidence — your people review, attest and decide.
Six promises — each backed by a screen you can open
COMPASS is not another reporting layer. It is the working surface for the whole FP&A cycle, built so that every number can be traced, every explanation carries evidence and every agent answers to a person.
01
One spine from ledger to landing
Monitor, close, explain, forecast, plan, decide and report run on the same definitions — so the board pack agrees with the ledger.
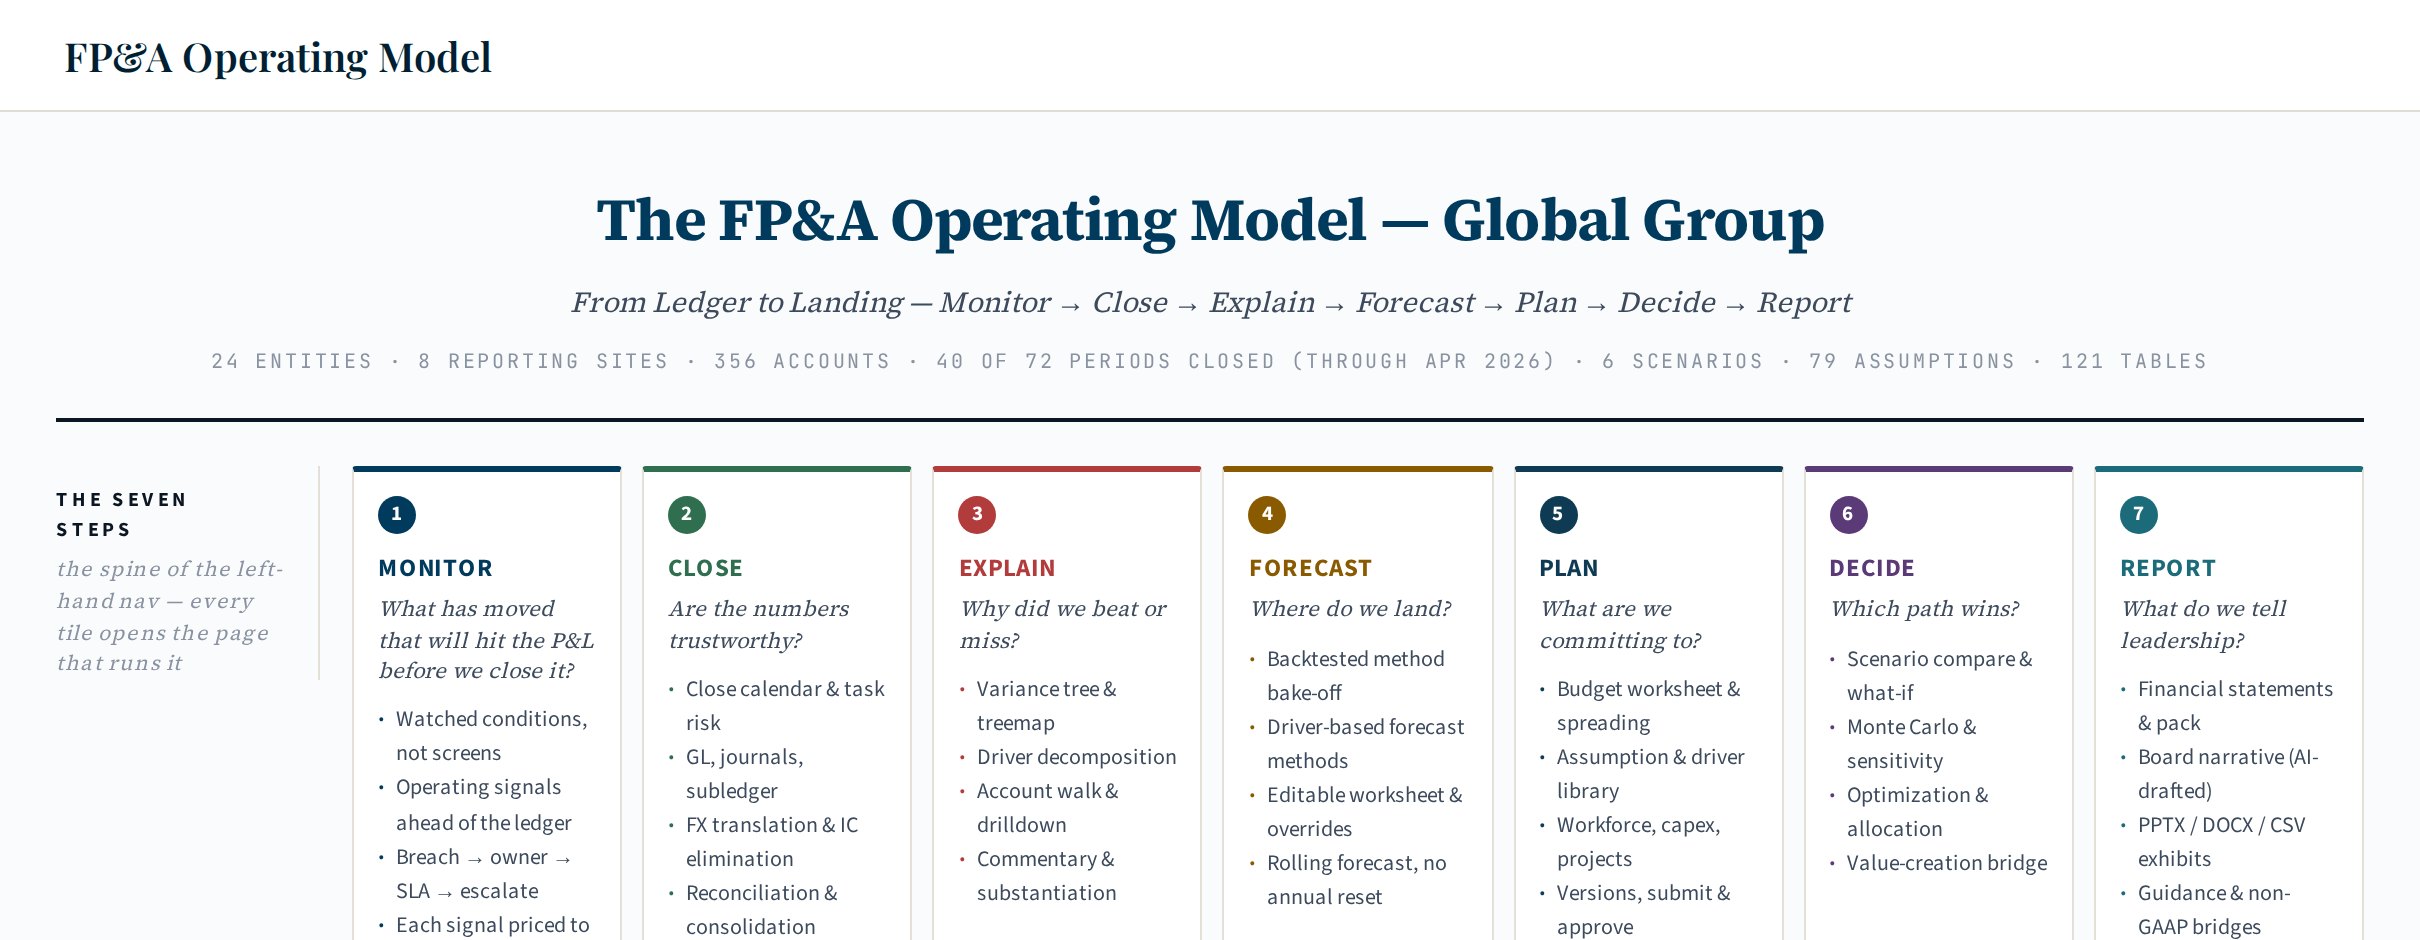
Seven-step cycle: every screen answers one question
Shared entities, accounts, periods and scenarios
Governed account and entity hierarchies
02
Explanations with evidence
Not “revenue was up”. Which lines, which drivers, how much of the gap — and the source behind every sentence.
Materiality triage: the few lines that explain ~80%
Driver decomposition that sums back to each line
Substantiation tree and provenance on every commentary line
03
Agents draft, people decide
Five supervised agents do the legwork inside the workflow. Nothing is attested, committed or posted without a named person.
Autonomy set per agent, from Observe to Autonomous
Approval chains by amount and entity
Every run, tool call and decision in the audit log
04
Plans calibrated to the ledger
The driver model reproduces last month’s actuals before it projects anything — so the plan starts from the truth.
One calculation graph: owned inputs vs formulas
Pull a driver, see exactly what moved and why
Commit changes into locked, versioned plans
05
Decisions under uncertainty
Put a range, not a point, in front of the CFO — and show what would have to be true for each case.
Base, upside and downside, probability-weighted
Monte Carlo and sensitivity on the driver model
Multi-agent war room that debates the plan
06
Runs on your own data platform
COMPASS is built on the DaasLabs Data Fabric Framework: it reads the bank’s ledger and feeds where they live. No new silo.
GL, sub-ledgers, planning and operating feeds via connectors
Ontology of accounts, entities and drivers shared with other accelerators
Explain the Month, in five steps and under a minute
A scripted walkthrough of the Explain the Month workflow with illustrative numbers from the demo environment. It plays when you scroll here; pause it or jump to any step.
Illustrative data
Site 01 · Global GroupApril 2026 · actual vs budgetExplain the Month
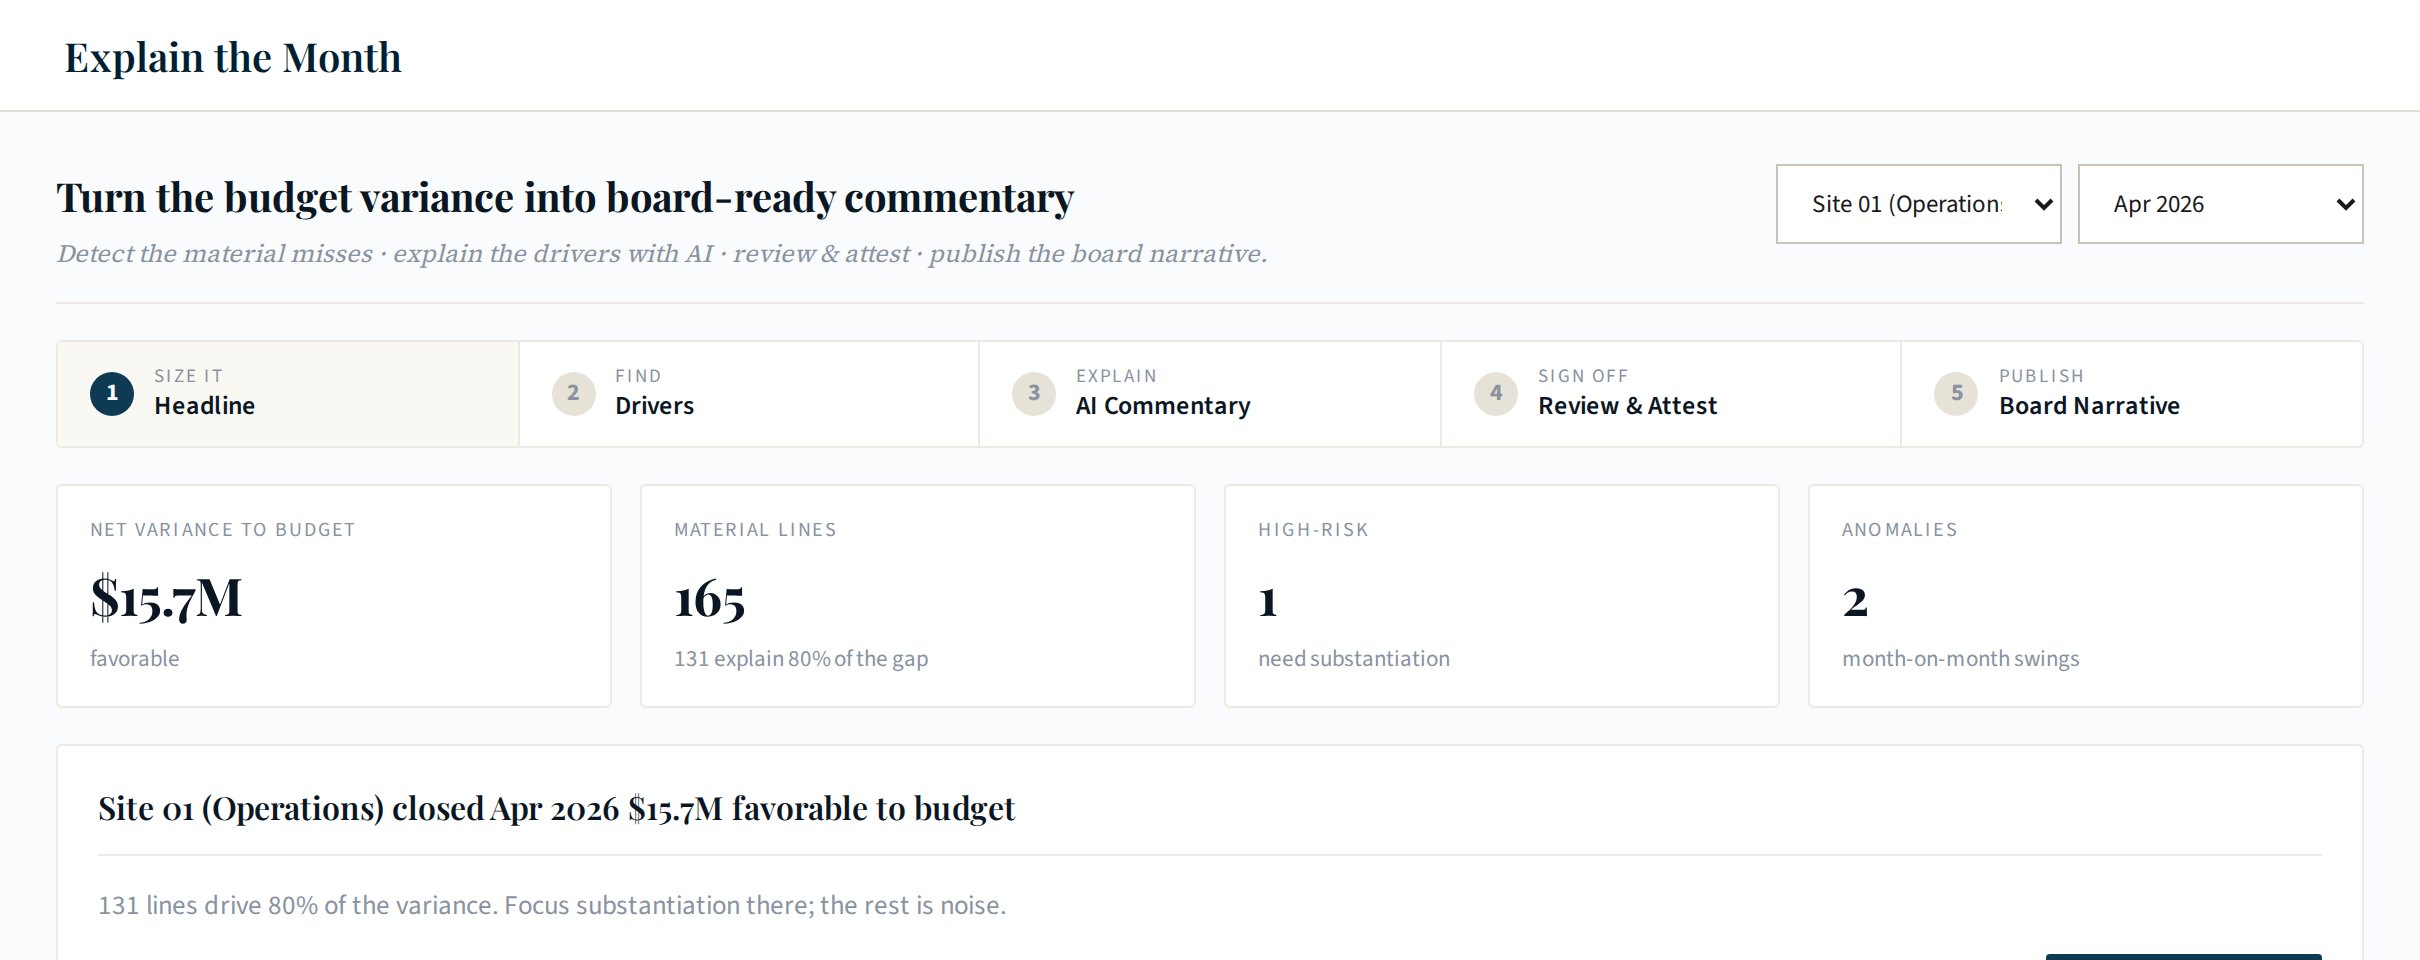
Size it: how big is the month?
The Variance Analyst sizes the gap against budget and counts the lines that clear materiality.
Net variance
$15.7M
favourable to budget
Material lines
165
clear $ floor and % of budget
Explain 80%
131
lines carry the gap
High-risk
1
needs substantiation · 2 anomalies
Site 01 closed April 2026 $15.7M favourable to budget.131 lines drive 80% of the variance. Focus substantiation there; the rest is noise.
Find the drivers
Each material line is decomposed into drivers that sum back to it. Rolled up, the month looks like this.
Concentration of the month
131 lines · 80%
131 of 165 material lines34 lines · 20%
Material lines165
Explain 80%131
Anomalies (MoM)2
High-risk1
AI commentary, with evidence
The Commentary Writer drafts the account-owner commentary and links every claim to its source.
Site 01 closed April $15.7M favourable to budget. Volume added $9.8M as Customer 04 and Customer 11 pulled orders forward from May; price realisation added $4.1M and a richer Division A mix $2.6M. FX translation cost $1.9M as the dollar strengthened. Timing of $1.1M reverses in May.
GL · April actualsDriver model v12Signal · order intake +8%FX · month-end ratesCustomer 04, 11 order book
Review and attest
A named reviewer edits the draft, checks the evidence and attests. The preparer can never attest their own line.
Volume added $9.8M as Customer 04 and Customer 11 pulled orders forward from May accelerated Q2 deliveries (about $3M pulled from May); price realisation added $4.1M and a richer Division A mix $2.6M. FX translation cost $1.9M.
AttestedJ. Lim · Financial Controller
Drivers reconcile to the $15.7M net variance
5 evidence links, all resolvable
Preparer ≠ reviewer (segregation of duties)
High-risk line routed to substantiation
Publish the board narrative
Attested lines roll up entity by entity into the board pack — with provenance carried all the way through.
Board pack · April 2026 · Global Group
April closed ahead of budget on volume and price; FX the only material drag
Site 01 +$15.7M: volume +$9.8M, price +$4.1M, mix +$2.6M
FX translation −$1.9M; hedge cover reviewed by treasury
$1.1M timing reverses in May; landing unchanged
14 sources 3 reviewers v1.0 · full audit trail
CloseSigned · WD6
Explain165 / 165 attested
ForecastRolled to May
Planv3 locked
Board packReady to sign
Agentic FP&A framework
Agents do the legwork. Finance owns the numbers.
COMPASS agents are part of the DaasLabs supervised digital workforce: every agent has a named owner, a set of tools, an autonomy level and a policy it cannot step outside. Here is how that works for FP&A.
01 · How an agent works in COMPASS
Plan → call tools → observe → propose → policy check → human approval → act & audit
Step 1 of 7
Plan
Turns the goal into a plan of tool calls
Agent
Worked example · Variance AnalystSite 01 · April close
Plan
The agent receives a goal and breaks it into steps it can execute with COMPASS tools.
> goal: explain Site 01 April variance vs budget > plan: size → triage → decompose top lines → draft
Tools = COMPASS services
GL & actuals
Variance engine
Driver model
Forecast
Close calendar
Commentary store
Click any step on the ring
02 · Agents across the cycle
Every step has an agent doing the legwork — and a person at the gate
Agents work where the effort is. The decisions that carry accountability — attesting commentary, approving the forecast, committing the plan and signing the board pack — stay with people.
Five levels of autonomy — the same scale as the rest of the digital workforce
Each COMPASS agent starts low and earns more autonomy on evidence. Levels, owners and 7-day metrics below are read live from the Digital Workforce registry.
0
Observe
Monitors and reports; takes no action.
1
Suggest
Drafts a recommendation; a person does the work.
2
Act with approval
Prepares the full action; a person approves every case.
3
Act within limits
Acts on its own inside policy limits; everything else is escalated.
4
Autonomous
Acts end to end; people review samples after the fact.
Variance Analyst
compass-variance
Level 2Act with approval
What it does
Sizes the month, triages material lines and decomposes each into volume, price, mix, FX and timing — with evidence.
Never without approval
Publish a driver explanation, change materiality thresholds or touch the ledger.
To earn the next level
Level 3 for lines below materiality once reviewer agreement stays ≥95% over three closes.
Drafts account-owner commentary with provenance, merges reviewer edits and rolls up the board narrative.
Never without approval
Mark a line attested or publish to the board pack — attestation is always human.
To earn the next level
Level 2 when reviewers change under 10% of words for three cycles, with zero unevidenced claims.
commentary_storeevidence_lookupnarrative_rollup
—runs · 7d
—override rate
—straight-through
—hours saved
Forecast Assistant
compass-forecast
Level 1Suggest
What it does
Proposes a rolling-forecast baseline from backtested methods and operating signals, and flags landing risk.
Never without approval
Overwrite a submitted forecast or roll the cut-off forward.
To earn the next level
Level 2 for roll-forward once backtest error stays inside the agreed band for six months.
rolling_forecastsignal_registerbacktest
—runs · 7d
—override rate
—straight-through
—hours saved
Close Sentinel
compass-close
Level 3Act within limits
What it does
Predicts the close landing from task history and dependencies, sends reminders and escalates tasks that will miss their gate.
Never without approval
Post or reverse a journal, or move a working-day gate.
To earn the next level
Level 4 only after two quarters of predicted landing within half a working day.
close_calendartask_historynotify
—runs · 7d
—override rate
—straight-through
—hours saved
Planning War Room
compass-warroom
Level 1Suggest
What it does
Runs a five-role debate on the plan (controller, analyst, bull, bear, treasury) and drafts a CFO memo.
Never without approval
Commit a plan version or change a driver — plans are committed by people.
To earn the next level
Stays at Suggest by design: the plan is a leadership decision.
driver_modelscenariosmulti_agent_debate
—runs · 7d
—override rate
—straight-through
—hours saved
Owner for all five agents: J. Lim (Financial Controller) · squad: FP&A squad.
04 · Guardrails built for FP&A
The controls a controller would insist on — enforced by policy, not by good intentions
Materiality thresholds
Lines above a dollar floor and a percentage of budget always go to a reviewer. Thresholds are configuration, not prompts.
Approval chains by amount and entity
Routing follows who owns the entity and how big the number is — the same chains your planning approvals use.
Segregation of duties
Preparer is never reviewer. An agent that drafts a line cannot approve it, and neither can the person who asked it to.
Locked plan versions
Committed plans and scenarios are locked. Agents work in a sandbox version; only people commit.
No posting to the GL without approval
Agents may prepare a journal or allocation run; posting always needs a named approver.
Evidence on every line
A commentary line without a resolvable source is rejected. Provenance is carried into the board pack.
Confidence thresholds
Below min_confidence_auto 0.90 nothing goes straight through; runs stop after max_tool_calls 8 and escalate.
Kill switch
One switch stops every agent from starting a run or applying an action — across COMPASS and the wider workforce.
Full audit log
Every run, tool call, proposal, approval and override is kept, with PII redacted from prompts sent to the model.
05 · Multi-agent planning war room
Five roles argue the plan so the CFO doesn’t get a one-sided answer
The war room runs the plan past a controller, an FP&A analyst, a bullish strategist, a sceptical bear and treasury & risk. It records consensus and dissent in a CFO memo. People commit the plan.
War room
Debate
Controller
Baseline from the driver model reproduces March actuals within 0.3%. Starting point: revenue +3.8%, EBITDA margin 19.6%.
FP&A analyst
Gap to the ambition is $42M EBITDA. Price +1.5 pts and Division C mix close about 60% of it.
Strategist · bull
Order-intake signals in Division A are running +8%. Pull the volume driver up two points.
Sceptic · bear
Two of the last three upside cases missed, and Customer 07 is 14% of Division A. Haircut that uplift by half.
Treasury & risk
A 5% stronger dollar erases $9M; hedge cover is 60%. Keep a P10 downside case alongside the base.
CFO memo · draftPlanning War Room · confidence 0.74
Recommend base plan: revenue +5.1%, EBITDA margin 20.4%, with a $9M FX buffer
Consensus: price and Division C mix are credible; volume uplift at half the bull case.
Dissent recorded (bear): Division A volume depends on one customer; revisit at the June re-forecast.
Decision needed: commit plan version v3 — people only.
06 · Measured like a workforce
Agents are judged on the same scorecard as people
Four numbers decide whether an agent keeps, gains or loses autonomy. Values are the FP&A squad’s last seven days in the Digital Workforce demo.
—
Straight-through rate
Share of runs completed inside policy with no human touch.
—
Override rate
Share of proposals a reviewer changed or rejected.
—
Reviewer agreement
Share of proposals approved as drafted.
—
Hours returned
Analyst hours saved across — runs.
Illustrative demo data from the Digital Workforce registry.
A forecast that rolls, and a close you can see landing
Two of the moments finance teams dread most — the re-forecast and the last days of close — become continuous and predictable.
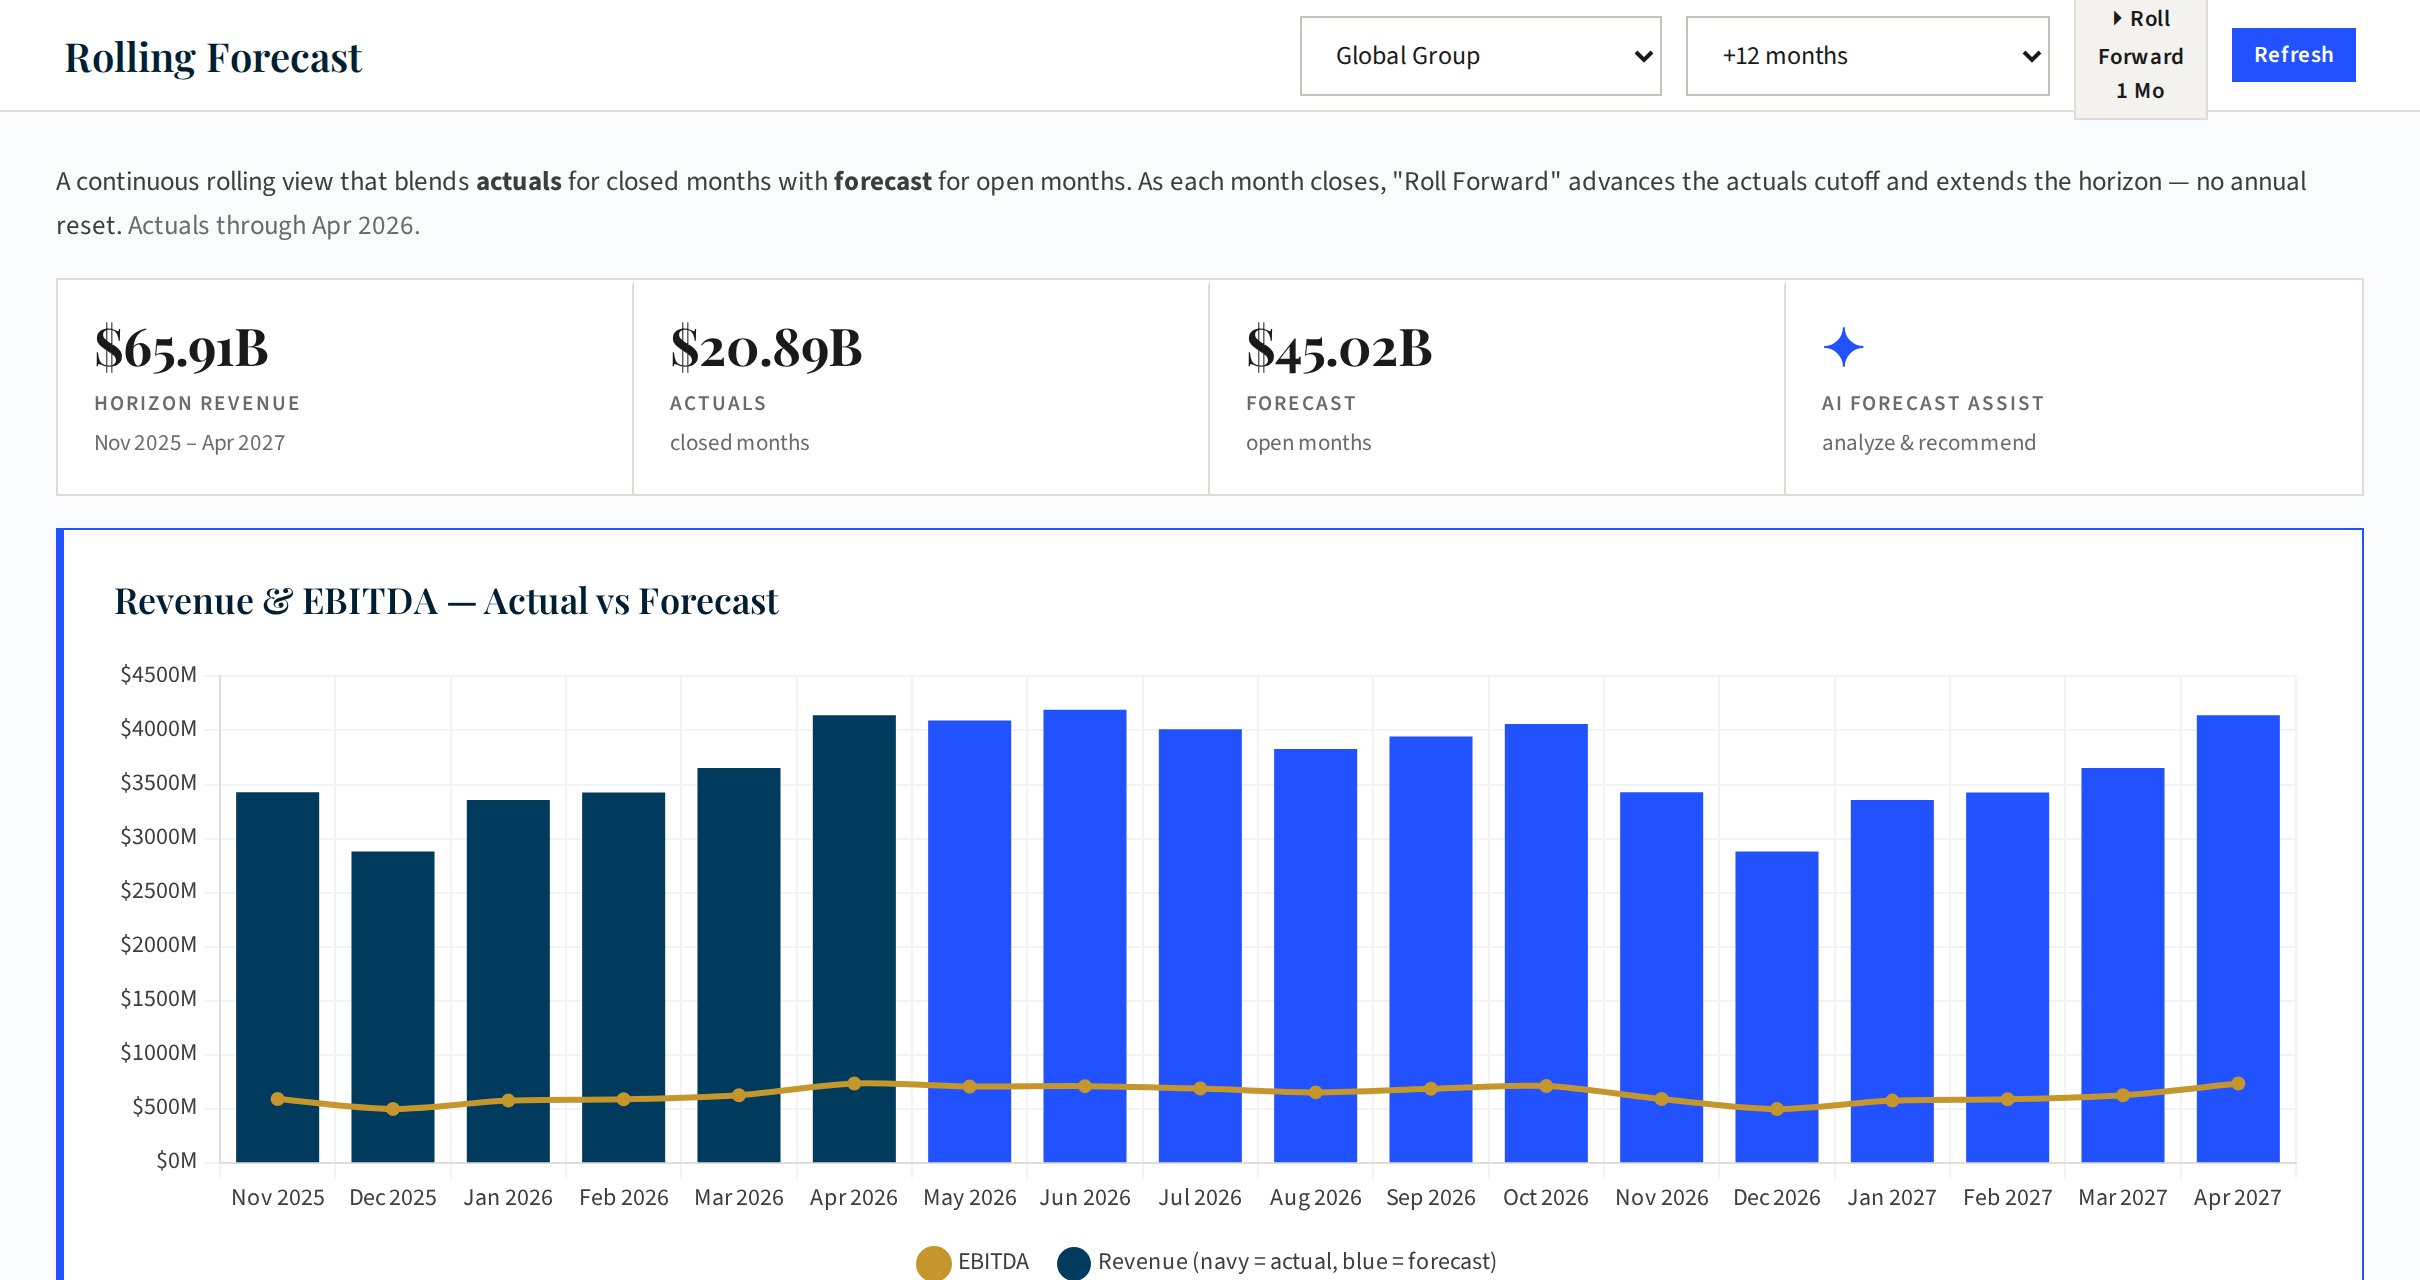
Rolling forecast
Cut-off: June 2026
Actuals for closed months, forecast for open ones. Each month the cut-off rolls forward and the horizon extends — no annual reset.
ActualForecastP10–P90 band
Close with predicted landing
Predicted landing WD6 · target WD6
Every task has a working-day gate and a history. Close Sentinel predicts the landing and escalates what will miss — before it misses.
WD1WD2WD3WD4WD5WD6WD7WD8WD9WD10
Sub-ledger close
Accruals
Intercompany match
FX translation
Allocations
Reconciliations
Consolidation
Explain & report
Landing WD6
Close Sentinel escalated Intercompany match to the IC owner with the 3 unmatched pairs — due WD4.
DonePlannedPredicted overrun
Capability map
57 modules, organised by the question they answer
Everything in COMPASS sits on one of the seven steps of the FP&A cycle, plus the AI and platform layers underneath. Modules with a blue top edge open a real screen.
1 · Monitor
What has moved that will hit the P&L?
Executive cockpitOne page of headline KPIs, guidance and trend for leadership.
Dashboards & builderCurated dashboards plus a builder for your own views.
Signal registerOperating signals ahead of the ledger: breach → owner → SLA → escalate.
2 · Close
Are the numbers trustworthy?
GL ledgerBalances and activity by entity, account and period.
JournalsPrepare, review and approve journals with evidence.
ReconciliationAccount reconciliations with status and ageing.
Currency & FX translationRates, translation and FX impact on results.
IntercompanyMatch, eliminate and settle intercompany balances.
Cash flowDirect and indirect cash flow from the ledger.
Allocations engineRules, trace and execution of cost allocations.
Allocation ↔ entity ↔ GL flowSee how allocated cost lands in legal entities and the GL.
EPM consoleConsolidation runs, loads and status in one place.
Data-load mappingsSource-to-target mappings for every feed.
Master data & hierarchiesAccount and entity hierarchies, versioned and governed.
Close operationsTask lists, owners, dependencies and sign-offs.
Data enginePipelines that keep actuals, plans and signals in step.
3 · Explain
Why did we beat or miss?
Account walkWalk an account from budget to actual, driver by driver.
Drill-downFrom group total to entity, account and transaction.
Compare scopesTwo entities, periods or versions side by side.
Substantiation treeHierarchy with RAG, owner and routing for every material line.
Commentary trackingCompletion and quality of commentary by owner and entity.
4 · Forecast
Where do we land?
Forecast worksheetEntity-by-account forecast entry with history alongside.
Signal-adjusted landingLanding adjusted for live operating signals.
5 · Plan
What are we committing to?
Drivers & assumptionsA governed library of rates, prices and volumes.
Budget buildBottom-up budget by entity, cost centre and account.
Capital planningCapital assets with depreciation that feeds the plan.
Project planningProject budgets, phasing and benefits.
Versions & sandboxTry changes safely; lock versions when committed.
Approvals chainRouting by amount and entity with a full trail.
6 · Decide
Which path wins?
Simulation & optimisationSearch the driver space for the best feasible plan.
Value-creation bridgeFrom today’s run-rate to the ambition, lever by lever.
7 · Report
What do we tell leadership?
Financial statementsP&L, balance sheet and cash flow from one source.
Guided metrics bridgesBridges from reported to guided metrics.
AI · AI & agents
Who does the legwork?
AI analystAsk questions of the numbers; answers cite the data.
AI planning war roomAmbition & gap → diagnose → baseline → value creation → calibrate → consensus → CFO memo.
Variance agentsAgents that size, triage and decompose the month.
Commentary qualityScores, challenges and evidence checks on every line.
— · Platform
How is it run?
ConfigurationEntities, periods, thresholds and calendars.
Admin & usersRoles, access and segregation of duties.
Audit logEvery change, approval and agent run.
ConnectorsGL, sub-ledgers, planning and operating feeds.
Inside the accelerator
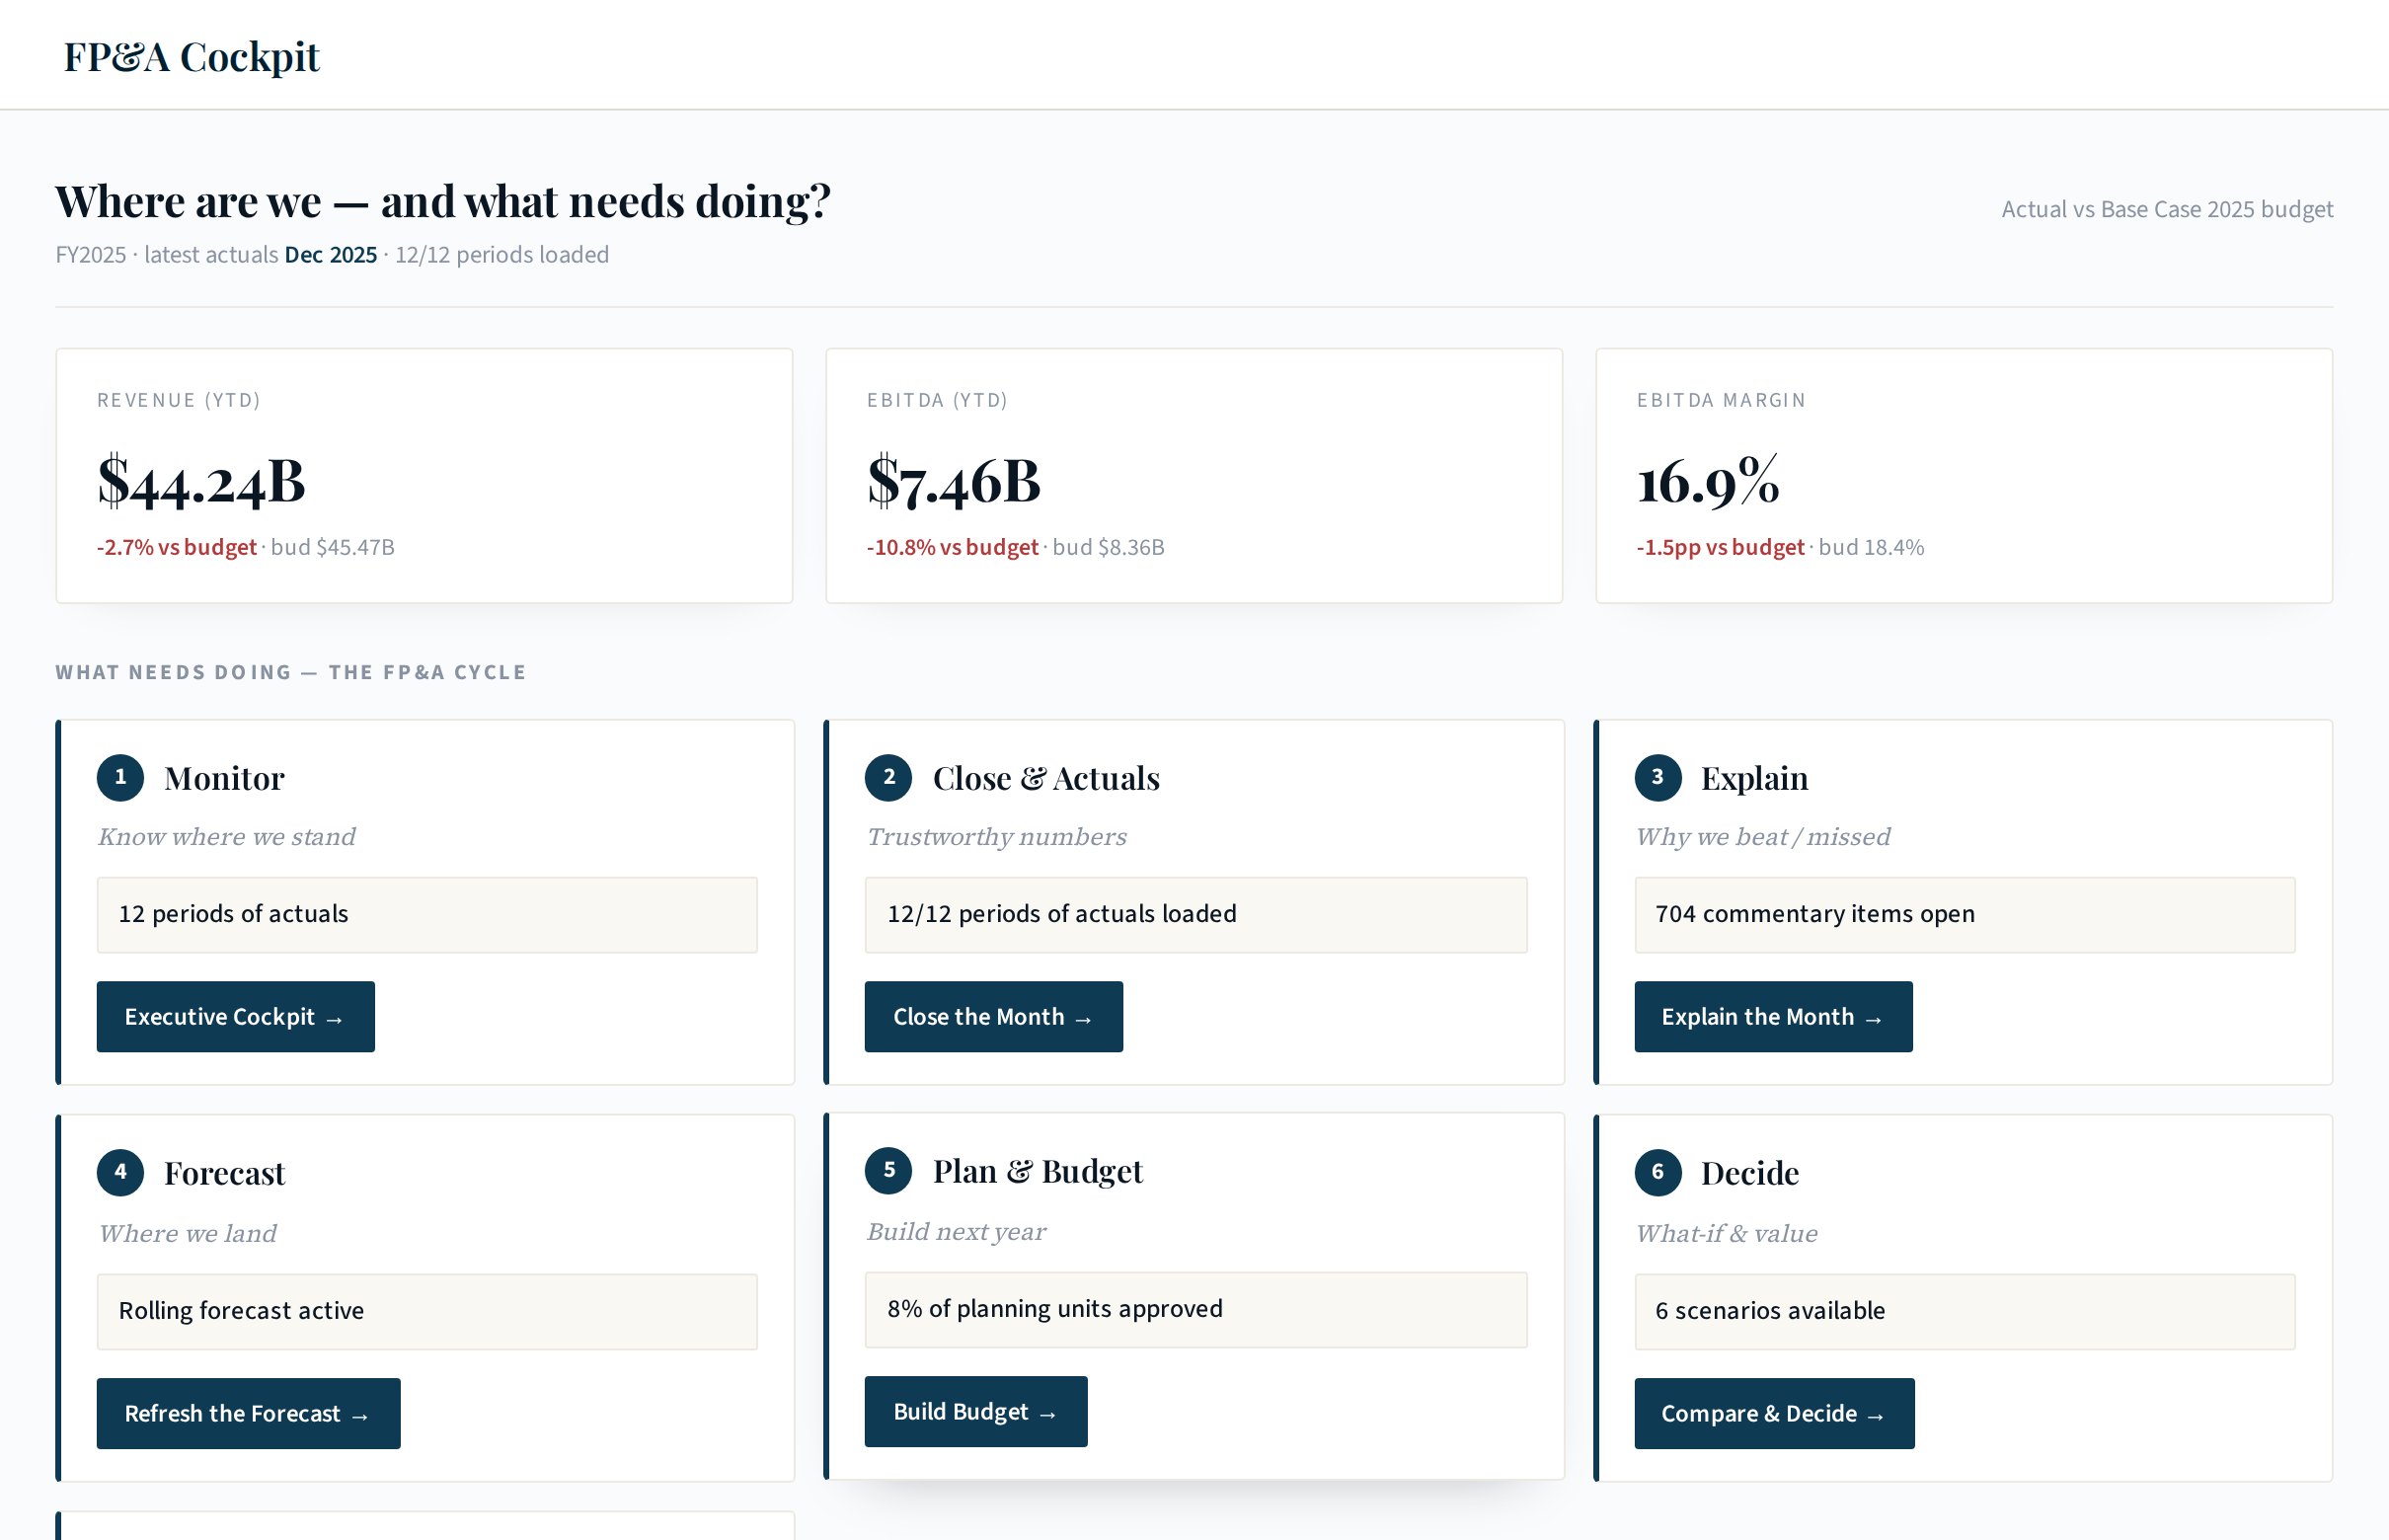
13 screens that carry a month from actuals to the board
Real screens from the COMPASS demo environment (data is illustrative and anonymised). The tour advances on its own; click the screen to enlarge and zoom.
compass / the fp&a operating model
Enlarge
1 / 13
Overview
The FP&A operating model
The spine of the product: seven steps from ledger to landing, each with the question it answers and the outcome it must produce.
Every navigation item maps to one step
Shared definitions of entities, accounts, periods and scenarios
Designed with finance leaders, not around a database
Who it’s for:CFO office, FP&A leads
Why DaasLabs
How COMPASS compares with the usual options
A fair view by category. Packaged planning suites are strong where they have always been strong; COMPASS is built to explain the month, put agents to work under control and run on the data platform you already have.
Capability
Spreadsheets & email
Packaged planning / EPM suites
BI dashboards
COMPASS by DaasLabs
Time to first value
DaysFamiliar, but manual every month (yes)
MonthsTypical programme before go-live (no)
WeeksReporting only (partial)
30–45 daysPilot on a live close (yes)
Explains variances with evidence
Manual (no)
PartialVariance reports; commentary by hand (partial)
PartialShows what, not why (partial)
YesTriage, drivers, provenance per line (yes)
AI drafts with human sign-off
No (no)
EmergingAdd-on assistants (partial)
Q&A onlyNot in a sign-off workflow (partial)
YesFive supervised agents, approvals (yes)
Driver model tied to actuals
FragileLinked workbooks (partial)
YesMature modelling (yes)
No (no)
YesCalibrated to last closed month (yes)
Close prediction
No (no)
Task listsChecklists, little prediction (partial)
No (no)
YesPredicted landing, escalation (yes)
Runs on your data platform
Files (no)
Own storeData copied into the suite (partial)
YesReads the warehouse (yes)
YesBuilt on your data fabric (yes)
Delivered and handed over by a team
No (no)
Via partnersIntegrator-led (partial)
No (no)
YesDaasLabs team + knowledge transfer (yes)
Packaged statutory consolidation & tax
No (no)
YesCore strength (yes)
No (no)
With LEDGER360 / NEXUSPaired accelerators (partial)
StrongPartialNot coveredCategories, not vendors. Assessment reflects typical deployments.
A delivery team, not just software
COMPASS comes with the DaasLabs team that connects your ledger, configures the cycle and runs the first closes with you — then hands it over. How we deliver →
Value in a 30–45 day pilot
We start where the pain is sharpest — usually explaining the month — and prove it on a live close before anything scales.
Banking-grade governance
Autonomy levels, policy limits, segregation of duties, kill switch and a full audit trail — the same controls as every DaasLabs agent. Governance & controls →
Where it fits in a bank
For the bank’s own finance function — and its corporate clients
Bank FP&A by business line, branch and productBudget, rolling forecast and variance commentary for retail, commercial and treasury lines, down to branch and product — explained with the same evidence standard.
Cost allocation to products and customersAllocation rules with full trace from cost centre to legal entity, GL and product profitability — so funds-transfer and shared-service costs land where they belong.
Close and reportingClose calendar with predicted landing, journals, reconciliation, intercompany and FX — working alongside LEDGER360, NEXUS and CLARION.
Workforce and capital planningHeadcount and fully loaded cost plans, capital projects with depreciation feeding the plan, and scenario-tested investment decisions.
A service for corporate and commercial clientsOffered as a value-added FP&A service to mid-market and large corporate clients, running on the bank’s data platform.
Move the sliders to match your finance function. The result is an estimate to frame a conversation, not a promise — the pilot measures the real number.
Estimate
—
Hours freed per month
From data preparation and commentary drafting.
—
Analyst capacity returned
Full-time equivalents redirected to analysis.
Board-ready commentary, working day
Commentary drafting runs in parallel with the last days of close.
Today—
COMPASS—
How it’s calculated. Prep hours freed = team × 140 productive h/month × prep share × automation share. Commentary hours freed = lines × hours per line × 60% (AI first draft; reviewer time kept). Capacity = hours freed ÷ 140. Turnaround: today, commentary starts after close and takes lines × hours ÷ (team × 6 h/day) working days; with COMPASS, drafting overlaps the last two days of close and review takes 40% of the effort. Benchmarks are industry figures, not COMPASS results.
Getting started
A 30–45 day pilot on a live close, then scale
We prove value where it hurts most — explaining the month — and extend across the cycle once the numbers are trusted.
Weeks 1–2
Connect and configure
Connect the GL, budget and forecast; load account and entity hierarchies.
Materiality thresholds and reviewers agreed
Agents registered with owners and autonomy levels
Approval chains mapped to your entities
Weeks 3–5
Explain the month, live
Run triage, drivers and AI commentary on a live close with your account owners.
Measure hours, turnaround and reviewer agreement
Tune agents, thresholds and evidence rules
First board narrative with provenance
Week 6 onwards
Extend and hand over
Add rolling forecast, close prediction, driver model and scenarios.
Board pack automation
Raise agent autonomy on evidence
Knowledge transfer to your FP&A team
Pilot
Prove it on one close
Fixed scope, 30–45 days, one or two entities. Success measures agreed up front.
Build & hand over
Roll out across the cycle
DaasLabs delivers the remaining steps on your platform, then transfers ownership to your team.
Managed service
We run it with you
DaasLabs operates COMPASS and the FP&A squad, including for the bank’s corporate clients.
See your own month explained
Book a walkthrough with your data model in mind — or first check where your finance function sits with the maturity self-assessment.
Benchmarks are third-party industry figures and are not COMPASS results. Screens and figures from the COMPASS demo environment use illustrative, anonymised data.
Click the image to zoom · Esc to close
AI
AI Analystagentic
I'm the DaasLabs AI Analyst, working with tools rather than from memory. I can:
Query the live platform APIs (disputes, fraud, AML, recon, revenue…)
Report what the digital workforce is doing: runs, approvals, overrides
Start an agent run on a real case and hand you the link to watch it